• Homicide Topics
Homicides by Month and Weekday / Summary
Is there a month of the year or a day of the week that is especially deadly where taxi driver homicides are concerned?
The Homicides by Month and Weekday / Table lists 223 of 226 Canadian Taxi Driver Homicides and identifies the month of the year and the day of the week when the fatal attack took place. This page summarizes the statistical data detailed in the table.
In each case the listings identify the day of the week and the month of the year In which the attacks took place.
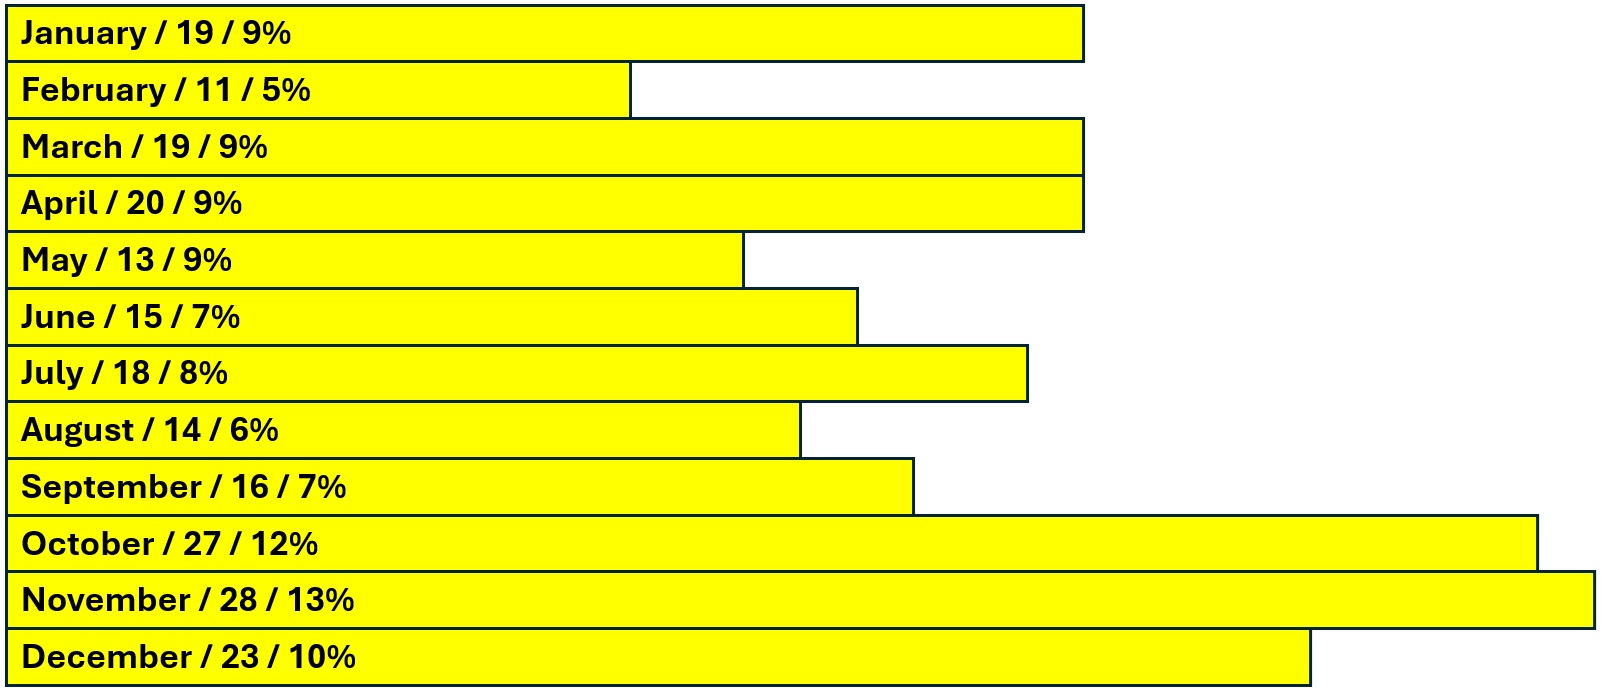
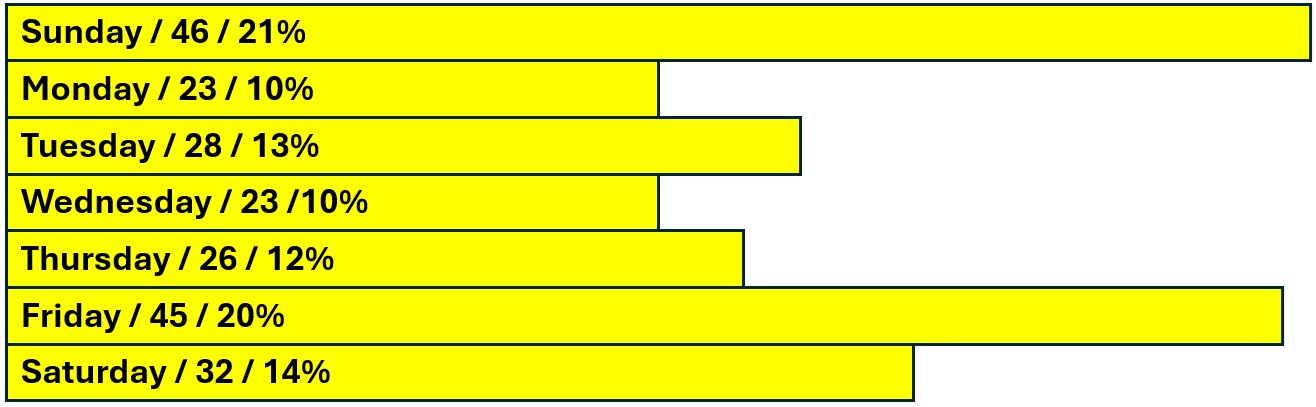
The two graphs below illustrate the number of homicidal attacks per month and day of the week with percentage out of 223 cases (the graphs are not to the same scale).
The graph showing the number of homicides per month reveals a noticeable spike for the months of October and November, which seems strange. One would expect a spike during the December-January holiday season when presumably there would be more opportunity for robberies resulting in homicides.
The graph showing the number of homicides per weekday shows a noticeable spike over the Friday to Sunday weekend, which seems understandable. The three days account for 55% of the 223 homicides.